
3 Common Investing Mistakes
Many people start out managing their own investments. But as their earnings and assets grow, their financial needs and challenges become more complex—and continuing to…


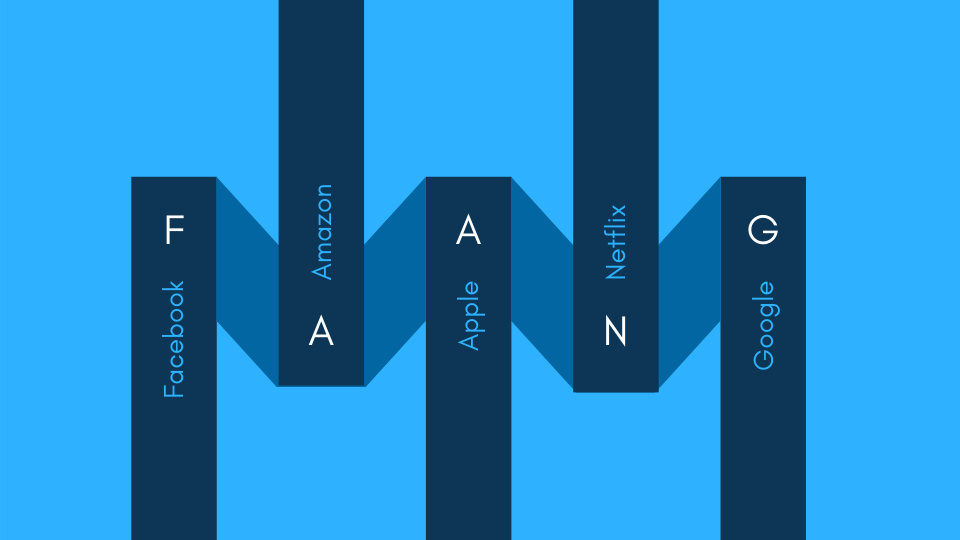
Exhibit 1: A Little Help from the FAANGs
Annualized US market compound returns with and without Facebook, Amazon, Apple, Netflix, and Alphabet (Google), 2009–2018
Investors may be surprised to learn that it is actually common for a subset of stocks to drive a sizable portion of the overall market return. Exhibit 2 shows that excluding the top 10% of performers each year from 19942 to 20183 would have reduced global market performance from 7.2% to 2.9%. Further excluding the best 25% of performers would have turned a positive return into a relatively large negative return.
Exhibit 2: Weighing the Impact
Global stock market performance excluding top performers, 1994–2018
This lesson also applies to capturing the premiums associated with a company’s size and its price-to-book ratio. Research by Eugene Fama and Kenneth French (“Migration” 2006) provides evidence that these premiums are driven in large part by a subset of stocks migrating across the market.
The tendency for strong market performance to be concentrated in a subset of stocks is therefore also a cautionary tale about the importance of diversification—investors with concentrated portfolios may actually miss out on the very stocks that deliver the best of what the market has to offer. An investment approach built around broad diversification can help achieve a more reliable outcome for investors over the long term—sharp acronym or not.
Exhibit 1: Source: Dimensional using data from the Center for Research in Security Prices (CRSP) covering the 10 calendar years since the financial crisis. With FAANGs portfolio formed each month including common stocks listed on NYSE, NYSE MKT, and NASDAQ. Stocks are weighted by market capitalization. Without FAANGs formed similarly but excluding Facebook, Apple, Amazon, Netflix, and Alphabet (Google). Past performance is no guarantee of future results.
Exhibit 2: “All stocks” includes all eligible stocks in all eligible developed and emerging markets at their market cap weights. Eligible stocks are required to meet a minimum market capitalization requirement. REITs and investment companies are excluded. Compound average annual returns are computed as the compound returns of the value-weighted averages of the annual returns of the included securities. “Excluding the top 10%” and “Excluding the top 25%” are constructed similarly but exclude the respective percentages of stocks with the highest annual returns by security count each year. Individual security data are obtained from Bloomberg, London Share Price Database, and Centre for Research in Finance. The eligible countries are: Australia, Austria, Belgium, Brazil, Canada, Chile, China, Colombia, Czech Republic, Denmark, Egypt, Finland, France, Germany, Greece, Hong Kong, Hungary, India, Indonesia, Ireland, Israel, Italy, Japan, Republic of Korea, Malaysia, Mexico, Netherlands, New Zealand, Norway, Peru, Philippines, Poland, Portugal, Russia, Singapore, South Africa, Spain, Sweden, Switzerland, Taiwan, Thailand, Turkey, the UK, and US. Diversification does not eliminate the risk of market loss. Past performance is no guarantee of future results.
1With-FAANGs portfolio formed each month including common stocks listed on NYSE, NYSE MKT, and NASDAQ. Stocks are weighted by market capitalisation. Without-FAANGs formed similarly but excluding Facebook, Apple, Amazon, Netflix, and Alphabet (Google). Source: Dimensional using data from CRSP.
2The onset of broad coverage of all-cap stock data across developed and emerging markets.
3All eligible common stocks in all eligible developed and emerging markets, ranked by total return. Source: Dimensional, using data from Bloomberg LP.
Adapted from How Markets Work and the FAANG Mentality by Dimensional Fund Advisors LP. Dimensional Fund Advisors LP is an investment advisor registered with the Securities and Exchange Commission. There is no guarantee investment strategies will be successful. Investing involves risks, including possible loss of principal. Investors should talk to their financial advisor prior to making any investment decision. There is always the risk that an investor may lose money. A long-term investment approach cannot guarantee a profit. Indices are not available for direct investment. Their performance does not reflect the expenses associated with the management of an actual portfolio. Past performance is not a guarantee of future results. Diversification does not eliminate the risk of market loss. All expressions of opinion are subject to change. This information is intended for educational purposes, and it is not to be construed as an offer, solicitation, recommendation, or endorsement of any particular security, products, or services.
Please remember that past performance may not be indicative of future results. Different types of investments involve varying degrees of risk, and there can be no assurance that the future performance of any specific investment, investment strategy, or product (including the investments and/or investment strategies recommended or undertaken by Beaird Harris Wealth Management, Inc.), or any non-investment related content, made reference to directly or indirectly in this blog will be profitable, equal any corresponding indicated historical performance level(s), be suitable for your portfolio or individual situation, or prove successful. Due to various factors, including changing market conditions and/or applicable laws, the content may no longer be reflective of current opinions or positions. Moreover, you should not assume that any discussion or information contained in this blog serves as the receipt of, or as a substitute for, personalized investment advice from Beaird Harris Wealth Management, Inc. To the extent that a reader has any questions regarding the applicability of any specific issue discussed above to his/her individual situation, he/she is encouraged to consult with the professional advisor of his/her choosing. Beaird Harris Wealth Management, Inc. is neither a law firm nor a certified public accounting firm and no portion of the blog content should be construed as legal or accounting advice. A copy of the Beaird Harris Wealth Management, Inc.’s current written disclosure statement discussing our advisory services and fees is available for review upon request.
Many people start out managing their own investments. But as their earnings and assets grow, their financial needs and challenges become more complex—and continuing to…

Beaird Harris is pleased to welcome three new partners: Nathan Biggs, Matt Edrington and Matt Skinner, to its public accounting practice, signifying the Firm’s continued…

Beaird Harris Named to Dallas Business Journal’s 2024 List of “Top 100 Money Managers.”